Yamazumi charts
Digital Yamazumi Chart Software
Levio Studio builds Yamazumi and operator balance charts straight from measured work elements. No retyping into a spreadsheet, no chart that quietly falls out of date the moment the study changes.
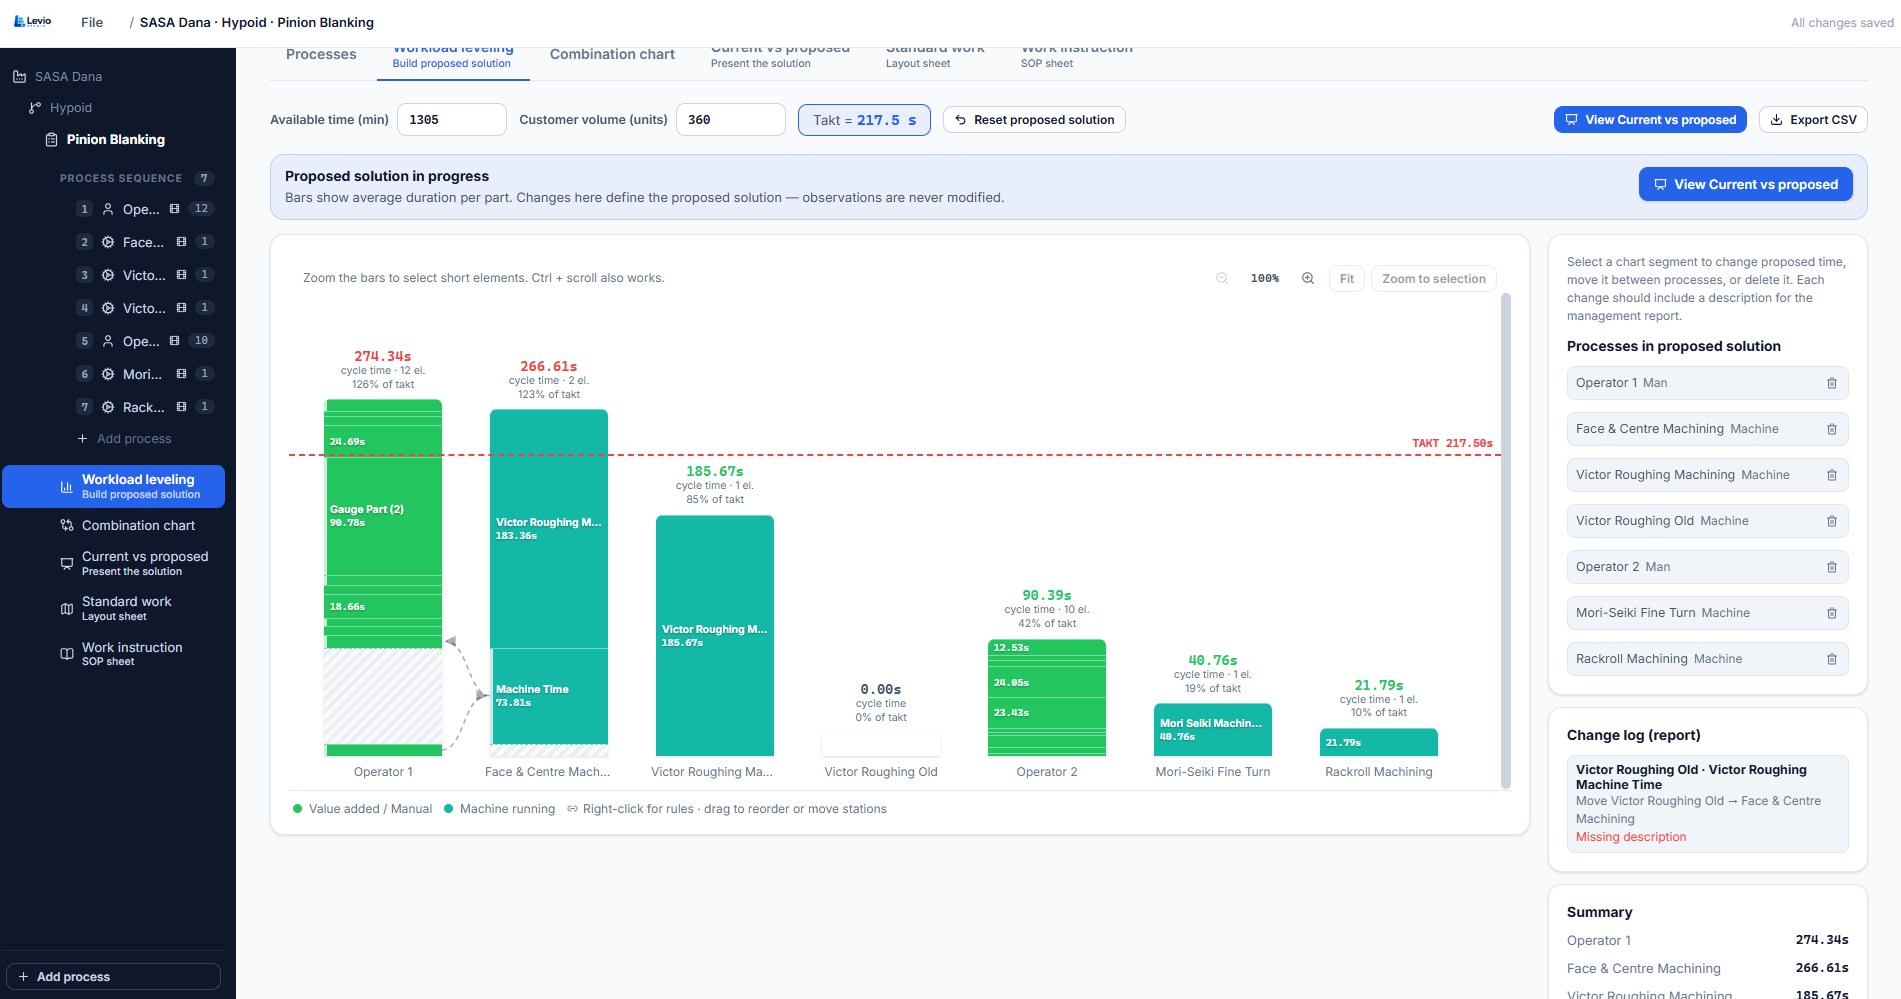
Charts stacked from real element data
Each block in the stack is a measured work element with its own duration and category, so the chart is not an approximation of the job — it is the job. Change the study and the chart follows.
- Colour-coded value-add, walk, wait and machine blocks
- Takt line drawn across every station
- Bottleneck station highlighted automatically
- Balance rate and manning reported with the chart
Reading the balance
Stations above the takt line limit output. Stations well below it are unused capacity. The colour split tells you which of the two problems you actually have: too much work, or too much of the wrong kind of work.
Simulating a better balance
Move elements between stations to test scenarios, then keep the current and proposed charts side by side to present the case. Sequencing rules stop elements from being placed in an order the process cannot support.
From chart to standard
Once a balance is agreed, the same element data produces the standard work combination view, the layout with operator path and the work instructions — so the chart is a step in the workflow, not a one-off deliverable.
Frequently asked
Buy your Levio Studio licence
Secure online payment in rand. Your product key and Windows installer are available immediately after checkout.